For MLP Nerds Only - A Deep Dive Into Strength of Schedule For Every Team
In other sports, strength of schedule (SOS) is discussed ad nauseum.
In NCAA basketball, it is a VERY hot topic come tournament time. Strength of schedule is an important factor in determining who makes the tournament and who doesn’t.
Up until now, we have not had a "regular season" in Major League Pickleball, so the idea of a strength of schedule has been irrelevant. While we have nearly 60 percent of the season completed in the Premier Level, strength of schedule is a real topic that is interesting to examine – at least for some of us.

How the strength of schedule is calculated
I used the simplest formula possible to calculate the strength of schedule.
First, I need to find the match win percentage of each team. However, the MLP way to calculate this is flawed, in my humble opinion. As you can see in the graphic above, MLP match win percentage is listed all the way to the right (I cut out other non-relevant stats).
Let’s look at the Columbus Sliders as an example. They have a team win percentage of 15.38 percent, according to MLP. They have two regulation wins, seven regulation losses, and four Dreambreaker losses. As a whole, yes, they have won 15.38 percent (2/13=15.38 percent). However, this doesn’t take into consideration whether a team wins or loses a Dreambreaker – just if they win or not.
In order to more accurately calculate a match win percentage, I am taking the number of points, dividing that number by three (number of points available in each match) and then dividing it by the number of matches. Let’s take the Sliders example again. They have 10 points, so 10/3=3.333. 3.3333/13 matches they have played = 25.65 percent win percentage.
This more accurately represents a team’s win percentage, because a regulation win or loss is different from a Dreambreaker win or loss, in terms of standings points.
Now that we have an accurate match win percentage, in order to calculate each team’s strength of schedule, we only need to find each team’s opponents’ average win percentage.
I took the schedule from every team, listed the win percentage of each opponent and came up with the SOS.
Premier Level strength of schedule
Overall SOS
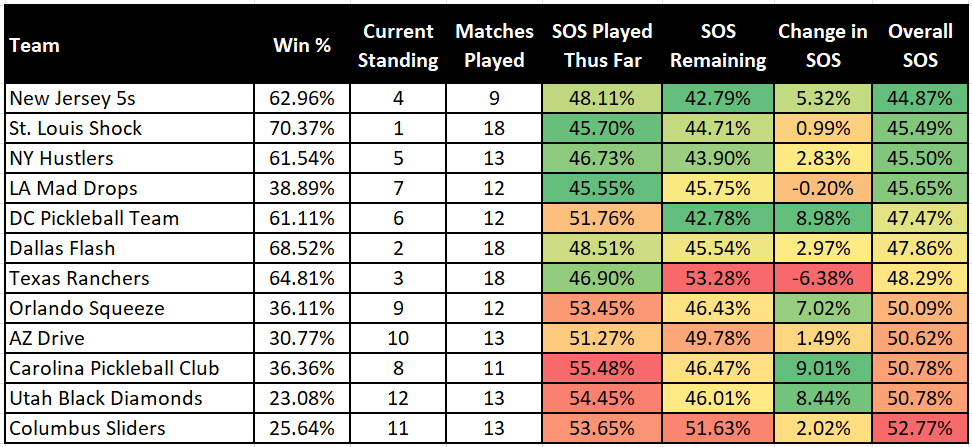
The column all the way to the right is each team’s SOS. The Sliders, in red, have an average opponent win percentage of 52.77 percent – meaning they have the hardest strength of schedule in 2024.
Conversely, the New Jersey 5s have the easiest strength of schedule so far. Their opponents are averaging 44.87 percent win percentage. This is nearly eight percentage points better than the Sliders.
Not surprisingly, for the most part the best teams have the lowest overall strength of schedule. They don’t have to play against themselves, therefore their SOS has a higher likelihood of being low.
Similarly, the teams at the lower end of the table also have the highest SOS.
SOS played thus far
This "SOS played thus far" column (four from right) shows what the team’s strength of schedule has been for the games they have already played.
The difference between the good teams and the bad teams is even more stark in this column. The three teams with the lowest win percentage have had the highest strengths of schedule. The biggest outlier here is the D.C. Pickleball Team, which is in sixth place, but has the fourth highest SOS – we will talk about them more below.
SOS remaining
This shows the SOS of the remaining games for each team.
The Ranchers have the toughest SOS in remaining games of all teams – good thing they only have to play five more matches. The D.C. Pickleball Team and the New Jersey 5s have the easiest SOS moving forward (virtually the same). They are both trying to move into the No. 1 or No. 2 seed from the No. 6 and No. 4, respectively.
Change in SOS
This shows the difference between SOS of the games a team has played and the games remaining. Green indicates the SOS has gotten better compared to other teams, while red is the opposite.
D.C., Utah, and Orlando all have a much easier schedule in the second half of the year. Meanwhile, Texas and the LA Mad Drops have a more difficult schedule than they have already played. With LA trying to make a huge comeback to sneak into the playoffs, this doesn't paint a great picture.
Biggest takeaway for Premier Level SOS
In our first ever Premier Level Power Rankings, we listed the percentage chance for each team to make the playoffs. I am even more convinced that D.C., NY, and NJ are all making the playoffs. I think they pretty much have the playoffs locked up.
The team that is very much on the outside looking in that has a chance for the playoffs is Orlando, with its weaker strength of schedule being a factor.
The Ranchers really want a top 1-2 seed, but they are going to have a tough time winning points against their last five opponents with three of those five matches against the 5s, the Shock, and the Flash.
Challenger Level strength of schedule
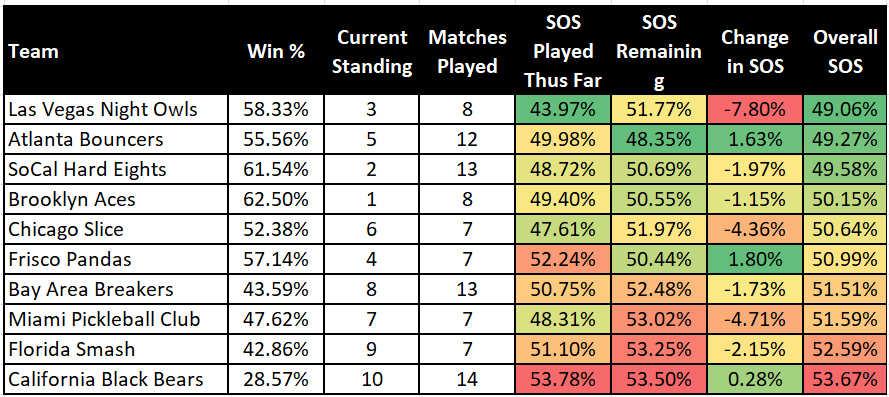
- The Night Owls have had the easiest SOS thus far, and they have the easiest SOS overall while sitting in third. Their chances of making the playoffs, especially after their changes, are good.
- The Florida Smash are in ninth place and have to play well in the second half of the year but face the second most difficult SOS.
- The Bouncers, in fifth place, have the easiest SOS remaining. With the women’s upgrade they pulled off last week, they look poised to make a run for the top two seeds.
If you made it this far, you are officially a pickleball data nerd. Congratulations!
Stay tuned next week, because I am going to review who the “most clutch” and “least clutch” players are in MLP.

Love Pickleball? Join 100k+ readers for free weekly tips, news & gear deals.
Subscribe to The DinkGet 15% off pickleball gear at Midwest Racquet Sports


